Sometimes, pressure equipment life needs to be extended above the initial design requirements and that represents an engineering challenge. Even less frequently, the design point also changes, making a priority to understand if the original design can withsthand the new operational settings without eroding the equipment performance.
This article provides a rough view of a project developed by SDEA where CFD modelling was used including a multi-phase solver and in-house developed functions to replicate the real behaviour of the condenser operational conditions.
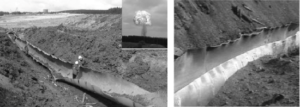
This condenser was part of a combined cycle power plant using a Rankine cycle. The aim of the low pressure equipment is to reduce the turbine back pressure and condensate the steam before it gets back into the boiler. A large number of tubes are placed inside the condenser, with a cooling fluid [brine in this case] running inside them. They are below the incoming steam dew point that takes energy away, condensing and separating by gravity the created droplets.
Condenser geometry simplified for CFD
Most condensers have been designed using analytic methods, which usually are lumped models that can reproduce more or less the overall performance but can not provide detailed data on the insights of the process. The main drawback for this approach is that small details like the tube bundle geometry or undetected stagnant high-aged fluid are critical if an optimized condenser is aimed at. The main solution is to build laboratory prototypes and do physical test with the associated high costs.
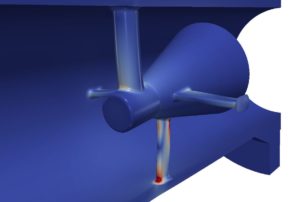
SDEA engineering team developed a comprehensive CFD model to emulate the condensation process with a high level of detail. Nevertheless, the vessel has two tube bundles with 14726 tubes each, resulting in very expensive computational model if every single tube was to be included in the final CFD model.
Bearing in mind the previous information, the main objectives of this study were to predict the velocities, temperature, density and pressure drop distribution inside the condenser for different operating conditions: those for the original design and for the upgraded normal conditions.
Due to the time scales involved in this project a simplified strategy was carefully selected after an exhaustive literature review, in order to achieve a good balance between accuracy and model complexity.

Condenser geometry CFD mesh
In this section the main assumptions will be explained and justified in order to provide a glimpse of not just SDEA’s CFD capabilities, also the physics understanding and the skills needed to carry on with projects like this and to complete all the goals stated in the project.
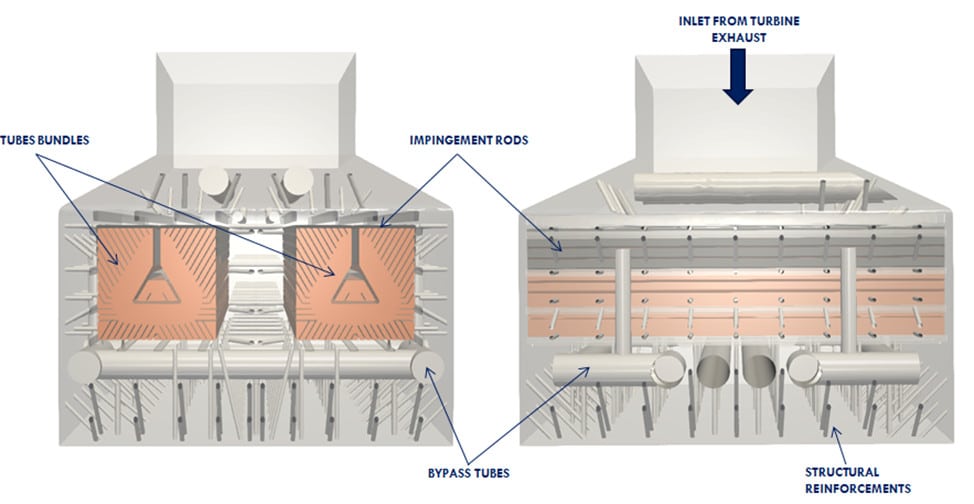
The cooling system is composed by two different bundles with more than 14K tubes. Modelling each single tube is unaffordable, so a porous media approach was assumed for this CFD model. This method does not require solving the detailed flow and temperature fields around each tube.
The tube bundle is regarded as a distributed resistance region. The resistance is based in the theory developed by Patakar and Spalding. Many different models have adopted this approach and it proves to match experimental data with reasonable accuracy.

Porous media submodelling
Porous media for the tube bundle region is modelled by the addition of a momentum source term to the standard fluid flow equations. The source added is a two terms expression including a viscous loss term and inertial loss contribution. Next equation details thematrix form included in the momentum transport balance for the tube bundle and the impingement rods region.
Due to the obvious anisotropic resistance of the tube bundle an orthotropic [different behaviour on each of the three axes of a Cartesian reference frame aligned with the tube bundle] scheme was adopted.
A local model was built for each direction and exposed to a wide range of velocities to obtain the equivalent pressure drop for each velocity field condition. The thermal resistance for the tubes has been calculated according to values and correlations obtained by several research papers. These include various terms in order to get the total value of the thermal resistance.

Thermal resistance vs cooling water velocity plot
The water side thermal resistance, Rw, is a function of the coolant water conductivity, flow characteristics and internal diameter of the tube.
The fouling thermal resistance, Rd, has been taken as an average value typically found in this type of condensers in previous research, with the usual value for the tubes heat transfer coefficient varying between 10000 and 35000 S.I. units depending on the position in the bundle.
Thermal resistances detailed above is an important issue. The heat transfer between the cooling tubes and the steam is important, in this matter different phenomena contributes on the overall energy transfer and the condensation flow rate depends due the mass transfer model used strongly on that heat balance.
The fluid is modelled as a single phase multi-component gas composed of steam; non-condensate was not included in the model for simplicity. The condensation mass sink term for the steam fraction is then computed based on the local heat transfer in each control volume according to the frequently used thermal resistance mass transfer model.
The thermal resistance mass transfer equation included T as the local gas phase temperature, L is the latent heat of condensation of the steam, A is the heat exchange area of the tubes in each control volume, V is the volume of the control volume and R the thermal resistance previously described.
A linear mean coolant temperature profile, Tw, is assumed along the tube bundle and is used to compute the heat transfer between the coolant and gas phase.

Final CFD results including plots and contours
After running different operational conditions cases, a comparison of velocities and temperatures was done to ensure the propper behavior of the condenser under the new set of conditions. Image above shows a glimpse on the type of results and insights you can get from an advanced CFD model like the one devoloped in this case.
Keep your curiosity in good shape.